Exports race to double-digit astride the RMG horse
Bangladesh may busk in one moral boost of crossing the $40 billion mark for the first time by another half a billion dollar to be exact.

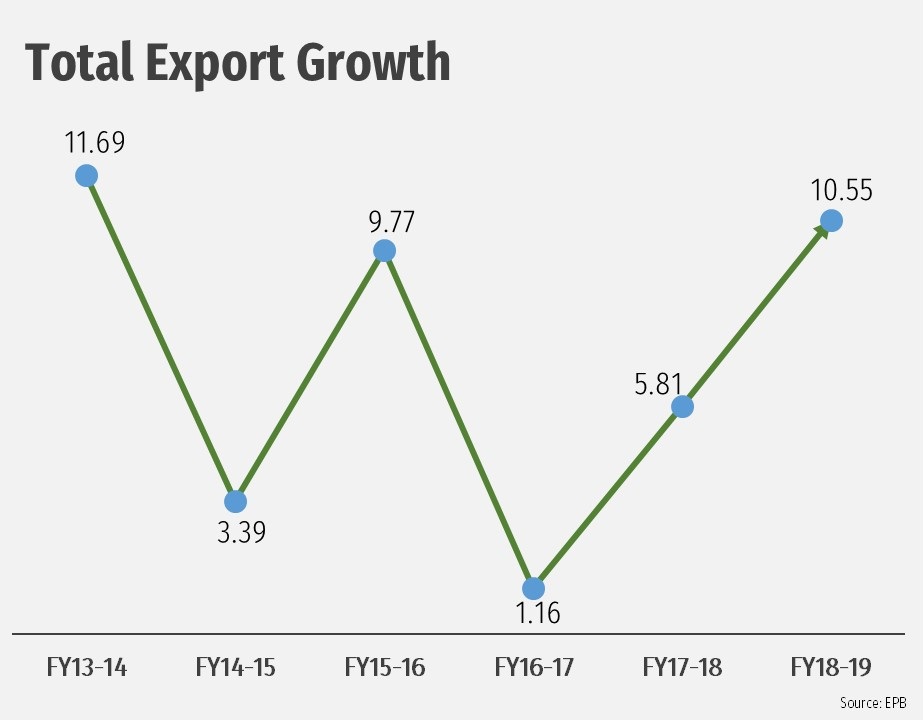
Bangladesh once again clocked a double digit export growth in the just concluded fiscal year, but its exports became even more concentrated on one single item - readymade garments.
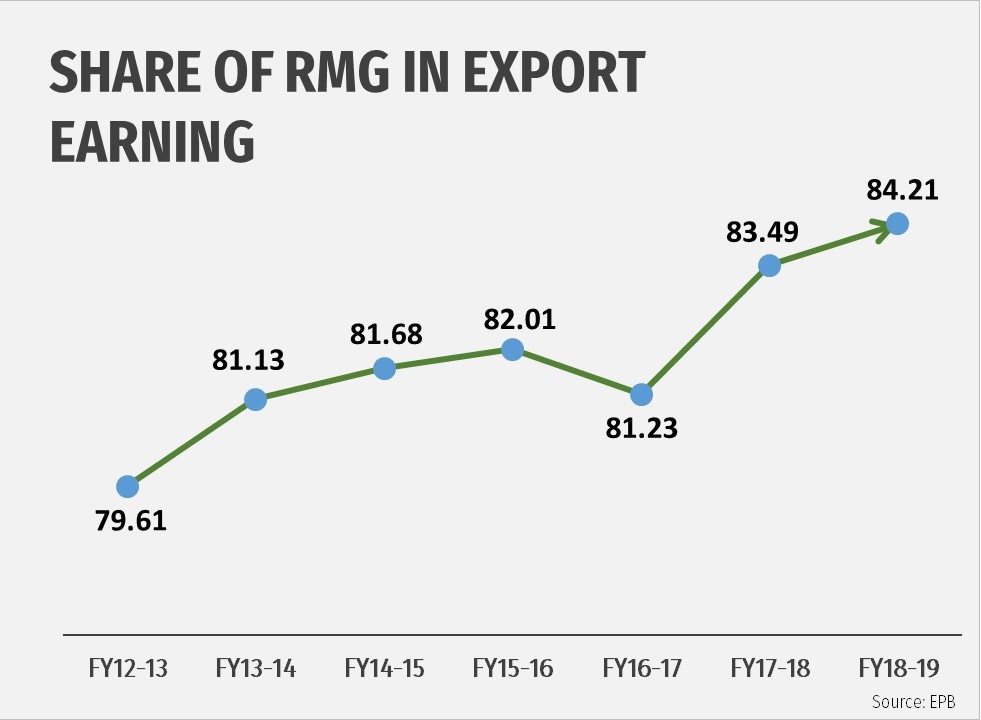
This all the more signifies the need for export diversification as garments alone accounted for over 84 percent of the total export value up from the previous year’s 83.50 percent.
Apparel’s dominance in the export basket – a phenomenon that has plagued Bangladesh’s trade for the last several years - leaves the country exposed to sudden external shocks, although at this moment garment enjoys a tailwind because of the US-China trade spat.
 Keep updated, follow The Business Standard's Google news channel
As the export figures are released on Monday, Bangladesh may busk in one moral boost of crossing the $40 billion mark for the first time by another half a billion dollar to be exact. It is 9.5 percent above the target set for the year.
Agriculture sector shows a good growth of 34 percent, but the figure may be misleading as most agricultural items dipped and only three items – dry food, vegetables and tobacco – jumped in exports.
Exports in manufactured goods also increased, though slightly, boosted by pharmaceuticals, furniture, petroleum products and chemical products.
Bangladesh also got a better foothold in leather footwear exports.
But all this was not enough to change Bangladesh’s story of external vulnerability and overwhelming dependence on apparels.
Experts have been warning that hinging on the export of a single item will not result in sustainability of the growth.
Jute, one the golden goose, lost its steam gained in the last five years and its exports tipped last fiscal year.
Overview
The country’s export earnings have registered a double-digit growth in the just-concluded financial year 2018-19, reaching 10.55 percent and exceeding the fiscal year’s overall export earnings target.
Earnings reached $40.53 billion, which is $3.86 billion more than the previous fiscal year’s $36.66 billion.
Also, the earnings in FY19 was $1.53 billion higher than the government-set target of $39 billion, according to data released by the Export Promotion Bureau (EPB) on Monday.
RMG rakes it in
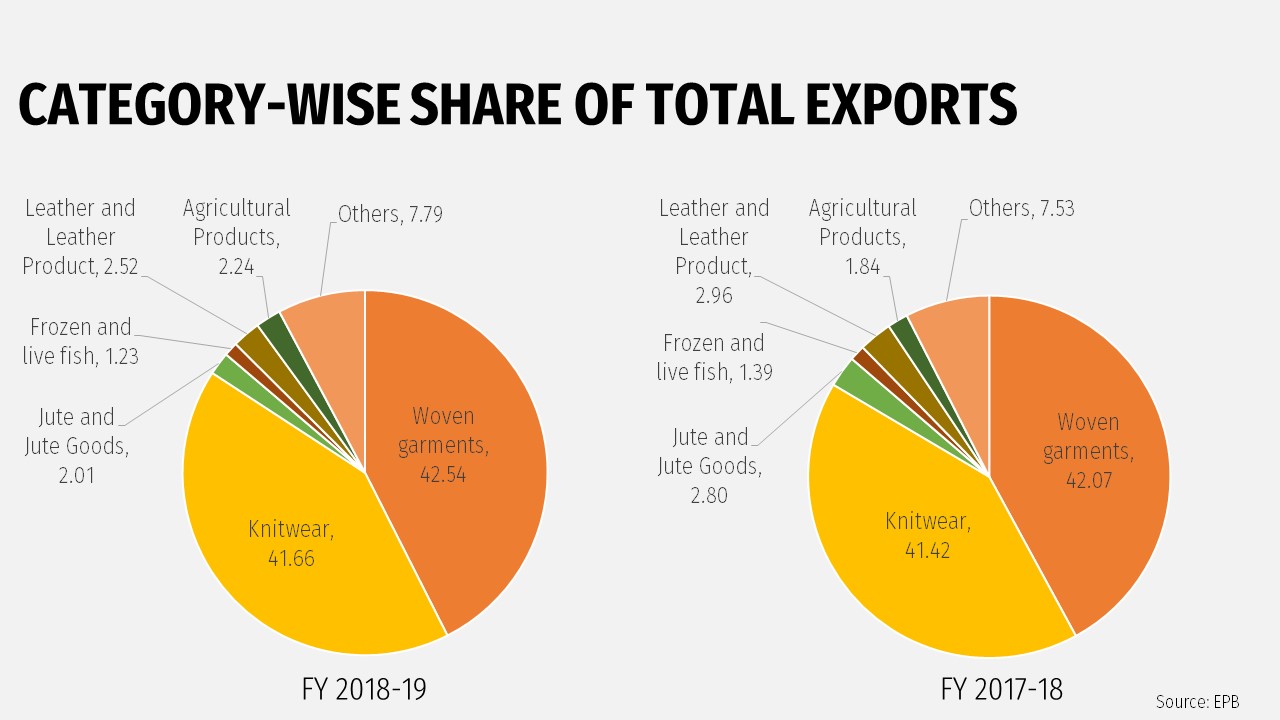
According to EPB data, the apparel sector fetched $34.13 billion in FY19, which is 84.21 percent of the total export earnings.
In FY18, the sector bagged $30.61 billion.
Apparel exceeded the export target by 4.44 percent in FY19, as the estimated earnings were set at $32.68 billion for the fiscal year.
Of the $34.13 billion, knitwear products earned $16.88 billion, 11.19 percent higher than the previous fiscal year. Woven items made $17.24 billion.
However, Bangladesh Garment Manufacturers and Exporters Association (BGMEA) President Rubana Huq is not satisfied with the export sector growth.
“I think the readymade garment sector growth is not showing a positive trend as per our expectations. We need to see the growth in terms of value. We need to analyse the export data to know how much value we are getting against what quantity,” said Rubana, who is also the managing director of Mohammadi Group.
“We are losing market share in the European Union but at the same time, it is increasing in the US,” she added.
Ananta Denim Technology Ltd Managing Director Sharif Zahir echoed Rubana‘s view, saying they are suffering a lot in terms of value.
“Unit margins are decreasing day by day due to the weak market situation globally. Retailers are also facing hardships because of competition with online platforms,” he said.
“Vietnam is doing good. They may outperform Bangladesh to become the second largest RMG exporter by FY20. One of the main reasons is that investors are feeling comfortable to put their money in Vietnam. The Vietnamese have earned the trust of investors,” said Zahir, also the director of BGMEA.
“The US-China trade war has played a role in shifting orders to Bangladesh from China. However, the clothing sector alone brought in about 85 percent of the total export earnings, while the contribution of other sectors is just 15 percent. This is not a healthy ratio and is also risky when it comes to export diversification,” said Dr Khondaker Golam Moazzem, research director of the Centre for Policy Dialogue (CPD).
“We are still far away from the realistic policies, initiatives and political moves needed to diversify our export basket in the long run. Some tax holidays and duty facilities are not effective masseurs. Those are very traditional thoughts,” he added.
‘Govt trying to diversify exports’
Abdus Salam Murshedy, president of Bangladesh Exporters Association (EAB), told the Business Standard the government was doing its best to diversify the export basket.
“There are plans to establish 100 economic zones. The government is identifying potential sectors and allocating zones for those,” he said.
Murshedy, also the managing director of Envoy Group, said the government should provide long-term policy support – such as tax holidays and bank loan with low interest rates – after allocating the economic zones.
“This year’s budgetary allocation for startups will be helpful in creating more entrepreneurs and they will contribute to export diversification,” he hoped.
“More than 100 items are being exported from Bangladesh. In addition to apparel, other sectors will perform better by the next five years. Then the export ratio of other items in comparison with clothing will be narrower.”
Export performance of other key sectors
Agricultural products saw a sharp rise in FY19, posting a 34.92 percent growth to reach $909 million, which was $674 million during the previous financial year. Among the agricultural products, vegetables earned $100 million, tobacco $63.33 million, and dry food $227.09 million.
Export earnings from pharmaceuticals increased by 25.60 percent, climbing to $130 million, and plastic goods by 21.65 percent to reach $120 million.
The specialised textile sector saw a 30.8 percent growth, earning $144 million, while non-leather footwear exports rose by 11.24 percent, reaching $271.53 million.
Export earnings from furniture, a newly-emerging export item, fetched $75 million, which was $63 million in the previous fiscal year.
Negative growth remains in some major sectors
Export earnings from leather and leather goods, the second largest foreign currency earner, witnessed a 6.06 percent negative growth, coming down to $1.01 billion from $1.08 billion.
Jute and jute goods, the third largest export earner, also registered a 20.41 percent negative growth, plunging to $816.27 million from $1025.55 million.
Export earnings of frozen and live fish also marked a negative growth, falling to $500.40 million from $508.43 million.
Besides, the home textile sector earnings fell by 3.07 percent, making $851.72 million, which was $878.68 million a year earlier.
Negative growth in June
EPB data showed the country’s export earnings witnessed a negative growth of 3.08 percent in the last month of FY19, reaching $2.93 billion. It was $3.03 billion in June of FY 18.
Exporters said the negative growth is due to the suspension of production and shipment for nearly 10 days because of Ramadan and Eid-ul-Fitr.
Comparative Statement on Export of RMG and Total Export of Bangladesh
|
Year |
Total export of Bangladesh |
Export of RMG |
% of RMG’S to total export |
|
2009-10 |
16204.65 |
12496.72 |
77.12 |
|
2010-11 |
22924.38 |
17914.46 |
78.15 |
|
2011-12 |
24301.90 |
19089.73 |
78.55 |
|
2012-13 |
27027.36 |
21515.73 |
79.61 |
|
2013-14 |
30186.62 |
24491.88 |
81.13 |
|
2014-15 |
31208.94 |
25491.40 |
81.68 |
|
2015-16 |
34257.18 |
28094.16 |
82.01 |
|
2016-17 |
34655.90 |
28149.84 |
81.23 |
|
2017-18 |
36668.17 |
30614.76 |
83.49 |
|
2018-19 |
40535.04 |
34133.27 |
84.21 |
Source: EPB data
Value of Total Apparel Export
|
Fiscal Year |
Woven |
Knitwear |
Total (in mn.us$) |
|
2010-2011 |
8432.40 |
9482.06 |
17914.46 |
|
2011-2012 |
9603.34 |
9486.39 |
19089.73 |
|
2012-2013 |
11039.85 |
10475.88 |
21515.73 |
|
2013-2014 |
12442.07 |
12049.81 |
24491.88 |
|
2014-2015 |
13064.61 |
12426.79 |
25491.40 |
|
2015-2016 |
14738.74 |
13355.42 |
28094.16 |
|
2016-2017 |
14392.59 |
13757.25 |
28149.84 |
|
2017-2018 |
15426.25 |
15188.51 |
30614.76 |
|
2018-2019 |
17244.73 |
16888.54 |
34133.27 |
Source: EPB data